
Siemens Healthineers has received 510(k) clearance from the U.S. Food and Drug Administration (FDA) for its Magnetom Flow.Ace MRI scanner.
Magnetom Flow.Ace is the company's first 1.5-tesla platform for MR imaging with a closed helium circuit and no quench pipe. The system has a 60 cm bore and is also the first Siemens MRI scanner to be marketed to the veterinary radiology community as well as for general radiology, with coils now available for both fields.
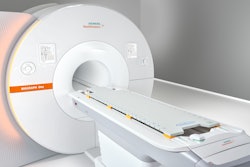
 Siemens Healthineers' Magnetom Flow.Ace 1.5-tesla MRI scannerSiemens Healthineers
The Magnetom Flow.Ace requires 0.7 liters of liquid helium for cooling, compared with conventional MRI scanners, which require more than 1,000 liters. This feature is due to the magnet’s DryCool technology, the company said.
The system design also eliminates the need for a quench pipe. In conventional scanners, this is needed to safely allow large amounts of gaseous helium to escape directly into the atmosphere during an emergency shutdown. The company also highlighted that the Magnetom Flow.Ace reduces annual energy consumption by more than 30%, owing to the system's Eco Power Mode.
The scanner uses AI to support automated workflows, improved image quality, and shorter exam times via its Deep Resolve image reconstruction technology, Siemens said.


![Overview of the study design. (A) The fully automated deep learning framework was developed to estimate body composition (BC) (defined as subcutaneous adipose tissue [SAT] in liters; visceral adipose tissue [VAT] in liters; skeletal muscle [SM] in liters; SM fat fraction [SMFF] as a percentage; and intramuscular adipose tissue [IMAT] in deciliters) from MRI. The fully automated framework comprised one model (model 1) to quantify different BC measures (SAT, VAT, SM, SMFF, and IMAT) as three-dimensional (3D) measures from whole-body MRI scans. The second model (model 2) was trained to identify standardized anatomic landmarks along the craniocaudal body axis (z coordinate field), which allowed for subdividing the whole-body measures into different subregions typically examined on clinical routine MRI scans (chest, abdomen, and pelvis). (B) BC was quantified from whole-body MRI in over 66,000 individuals from two large population-based cohort studies, the UK Biobank (UKB) (36,317 individuals) and the German National Cohort (NAKO) (30,291 individuals). Bar graphs show age distribution by sex and cohort. BMI = body mass index. (C) After the performance assessment of the fully automated framework, the change in BC measures, distributions, and profiles across age decades were investigated. Age-, sex-, and height-adjusted body composition reference curves were calculated and made publicly available in a web-based z-score calculator (https://circ-ml.github.io).](https://img.auntminnie.com/mindful/smg/workspaces/default/uploads/2026/05/body-comp.XgAjTfPj1W.jpg?auto=format%2Ccompress&dpr=2&fit=crop&h=167&q=70&w=250)
